
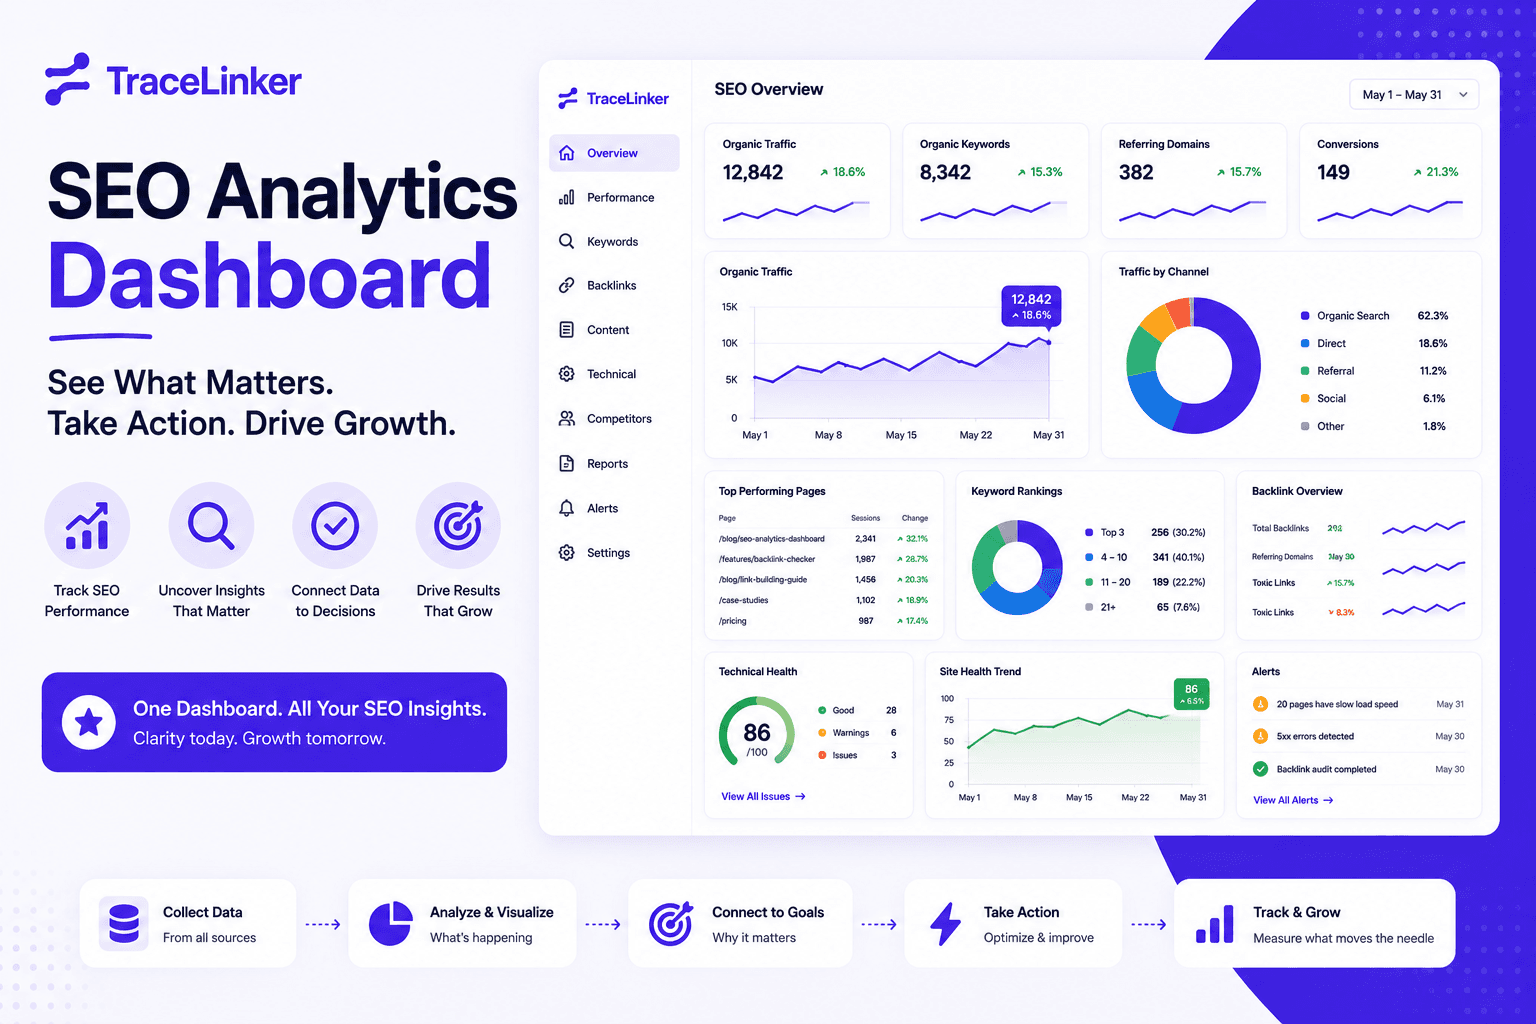


SEO Analytics Dashboard: How to Build One That Actually Gets Used in 2026
Most SEO analytics dashboards are abandoned within a month. They look impressive during setup, but soon become a graveyard of charts nobody checks. The problem is rarely the tool. It is the strategy behind the dashboard: too many metrics, unclear ownership, and no connection to decisions.
A useful dashboard answers one question fast: is our SEO moving the business forward? This guide shows you how to build an SEO analytics dashboard that stays relevant, gets shared, and actually drives action.
What is an SEO analytics dashboard?
An SEO analytics dashboard is a centralized interface that pulls search performance data from multiple sources into a single view. It typically tracks:
- Organic traffic and user behavior
- Keyword rankings and visibility
- Backlink profile and authority
- Technical health and site performance
- Conversions and revenue from organic search
Instead of logging into Google Analytics, Search Console, Semrush, and Ahrefs separately, the dashboard surfaces the metrics that matter in one place. The goal is not to replace deep analysis. It is to make status checks fast and decision-making easier.
Why most SEO dashboards fail
Dashboards fail for the same reasons reports do: they focus on data instead of understanding. Common failure points include:
- Metric overload: twenty charts where three would do.
- No clear owner: nobody is responsible for updating or interpreting it.
- Vanity KPIs: rankings and impressions without traffic or conversion context.
- Static exports: dashboards that are manually refreshed and forgotten.
- Missing narrative: numbers without "so what" and "what next."
If a non-SEO stakeholder cannot understand the dashboard in five minutes, it will not be used. Design for clarity first, sophistication second.
The metrics that belong in every SEO analytics dashboard
Limit your dashboard to a small set of goal-driven KPIs. Everything else is a supporting detail.
| Category | Metric | Why it matters |
|---|---|---|
| Traffic | Organic sessions | Are more people arriving from search? |
| Traffic | Organic conversions | Is that traffic turning into leads or sales? |
| Rankings | Keyword visibility / search visibility score | Are we gaining or losing share of search? |
| Rankings | Top keyword movements | Which priority terms are moving toward page one? |
| Content | Top landing pages | Which pages drive the most qualified organic traffic? |
| Technical | Core Web Vitals / Lighthouse score | Is site performance helping or hurting rankings? |
| Authority | New and lost backlinks | Is the link profile growing or shrinking? |
| Authority | Domain authority / domain score | Is overall authority trending up? |
| Local | Local pack rankings | Are local keywords moving in the map pack? |
| Goals | SEO goal completion | Are we hitting the targets we agreed on? |
Pick 4–6 metrics that map directly to the client’s or business’s goals. If a metric does not inform a decision, remove it.
Data sources to connect
An SEO dashboard is only as good as the data feeding it. The most reliable sources are:
- Google Analytics 4: traffic, user behavior, conversions, and e-commerce data.
- Google Search Console: impressions, clicks, average position, and index coverage.
- Rank tracking tools: keyword positions, search visibility, and competitor comparisons.
- Backlink tools: Ahrefs, Semrush, or Majestic for link profile and authority metrics.
- Page speed tools: Google Lighthouse or PageSpeed Insights for Core Web Vitals.
- CRM or conversion data: lead source attribution and revenue from organic search.
If you are still configuring your measurement stack, our guide on configuring Google Analytics walks through GA4 setup so your dashboard has trustworthy traffic and conversion data from day one.
How to build an SEO analytics dashboard, step by step
Step 1: Define the dashboard’s purpose
Start with one question: who will use this dashboard and what decision do they need to make?
- A CMO wants high-level trends and ROI.
- An SEO manager wants keyword movements and technical alerts.
- A content team wants top pages and publishing performance.
One dashboard cannot serve everyone perfectly. Build for the primary audience and add detail only where it helps them.
Step 2: Choose your metrics
From the table above, select the 4–6 metrics that match your goal. Write a one-line business reason for each. If you cannot explain why the metric matters, drop it.
Step 3: Pick the right visualization
| Metric | Best visualization |
|---|---|
| Organic traffic | Line chart with MoM comparison |
| Conversions | Number tile with percentage change |
| Keyword rankings | Bar chart of net gains/losses or striking-distance keywords |
| Backlinks | Stacked bar of new vs. lost links |
| Site performance | Score gauge or trend line |
| Top landing pages | Table with traffic, bounce rate, conversions |
Avoid pie charts for SEO data. Trends and comparisons are almost always clearer.
Step 4: Connect data sources
Most dashboard tools connect to Google Analytics, Search Console, and third-party SEO tools via native connectors or API. For custom data, Google Sheets is a reliable bridge.
If you are importing backlink data from Ahrefs, Semrush, or a CSV export, clean it first. Use TraceLinker’s backlink CSV analyzer to classify links, detect anchor text issues, and flag toxic patterns before the data reaches your dashboard.
Step 5: Add context and thresholds
Numbers alone create anxiety. Add context:
- Targets: show the goal line next to the current value.
- Trends: compare to the previous period and the same period last year.
- Alerts: highlight metrics that crossed a threshold, like a 20% traffic drop or a lost backlink.
A dashboard with alerts keeps itself relevant. Without alerts, it becomes a report nobody reads.
Step 6: Share and schedule
Set a recurring delivery schedule. Monthly is standard for strategic dashboards; weekly for active campaigns. Share a link or schedule a PDF snapshot. Make it easy for stakeholders to access the dashboard without another login.
Dashboard layout ideas that work
Keep the most important metrics at the top. A simple layout for a marketing dashboard:
- Top row: organic sessions, organic conversions, search visibility score, keyword ranking net change.
- Middle row: line chart of organic traffic over time, table of top landing pages, bar chart of new vs. lost backlinks.
- Bottom row: technical health score, Core Web Vitals trend, and a text box for notes or next steps.
The bottom section should always include the narrative: what changed, why, and what is next.
Tools for building an SEO analytics dashboard
| Tool | Strength | Best for |
|---|---|---|
| Google Looker Studio | Free, highly customizable | Teams with analyst support |
| AgencyAnalytics | Plug-and-play agency dashboards | Agencies managing many clients |
| Geckoboard | Simple, TV-friendly dashboards | Small teams wanting live status |
| Klipfolio | Flexible KPI dashboards | Marketing teams with varied data sources |
| TraceLinker | Backlink-focused scoring, alerts, CSV/PDF exports | Teams prioritizing link monitoring and reporting |
For agencies that need white-label reports, tools like AgencyAnalytics and TraceLinker offer branded PDF exports and shareable links.
How TraceLinker fits into your dashboard workflow
Backlinks are one of the hardest SEO metrics to visualize clearly. Raw link counts do not tell the story. TraceLinker helps by scoring each link 1–100 with transparent reasoning, tracking link state changes over time, and exporting clean data for dashboards.
Use TraceLinker to:
- Import backlink CSVs from Ahrefs, Semrush, or GSC.
- Classify links and detect toxic patterns before they hurt rankings.
- Monitor new and lost backlinks with hourly, daily, or weekly re-crawls.
- Export CSV and PDF reports that plug into your dashboard or client report.
If your dashboard includes a backlink section, start with the backlink report template to standardize the format, then use the anchor text analyzer to keep the profile natural.
Common SEO dashboard mistakes
- Tracking too many keyword rankings: focus on priority terms, not every keyword in the database.
- Ignoring assisted conversions: SEO often contributes to journeys that convert later through other channels.
- Using averages that hide problems: average position can rise while critical keywords fall.
- Forgetting technical health: traffic and rankings are outputs; site performance is an input.
- Not updating goals: dashboards stuck on last quarter’s targets become irrelevant fast.
When to use a dashboard vs. a report
Dashboards are for monitoring and quick decisions. Reports are for deeper analysis and client communication. Most teams need both: a live dashboard for internal use and a monthly report for stakeholders. If you need a report template that translates dashboard data into client-ready language, our client SEO report guide provides a proven structure.
Final thoughts: a dashboard is a decision tool, not a decoration
The best SEO analytics dashboard is the one that gets used. That means fewer metrics, clearer context, and a direct line to action. Choose the metrics that drive decisions, connect reliable data sources, and add a narrative that explains what changed and what happens next.
Start with the essentials. You can always add complexity once the dashboard proves its value. If backlinks are part of your SEO story, sign up for TraceLinker and use the free backlink checker, CSV analyzer, and reporting exports to keep your dashboard data accurate and actionable.