
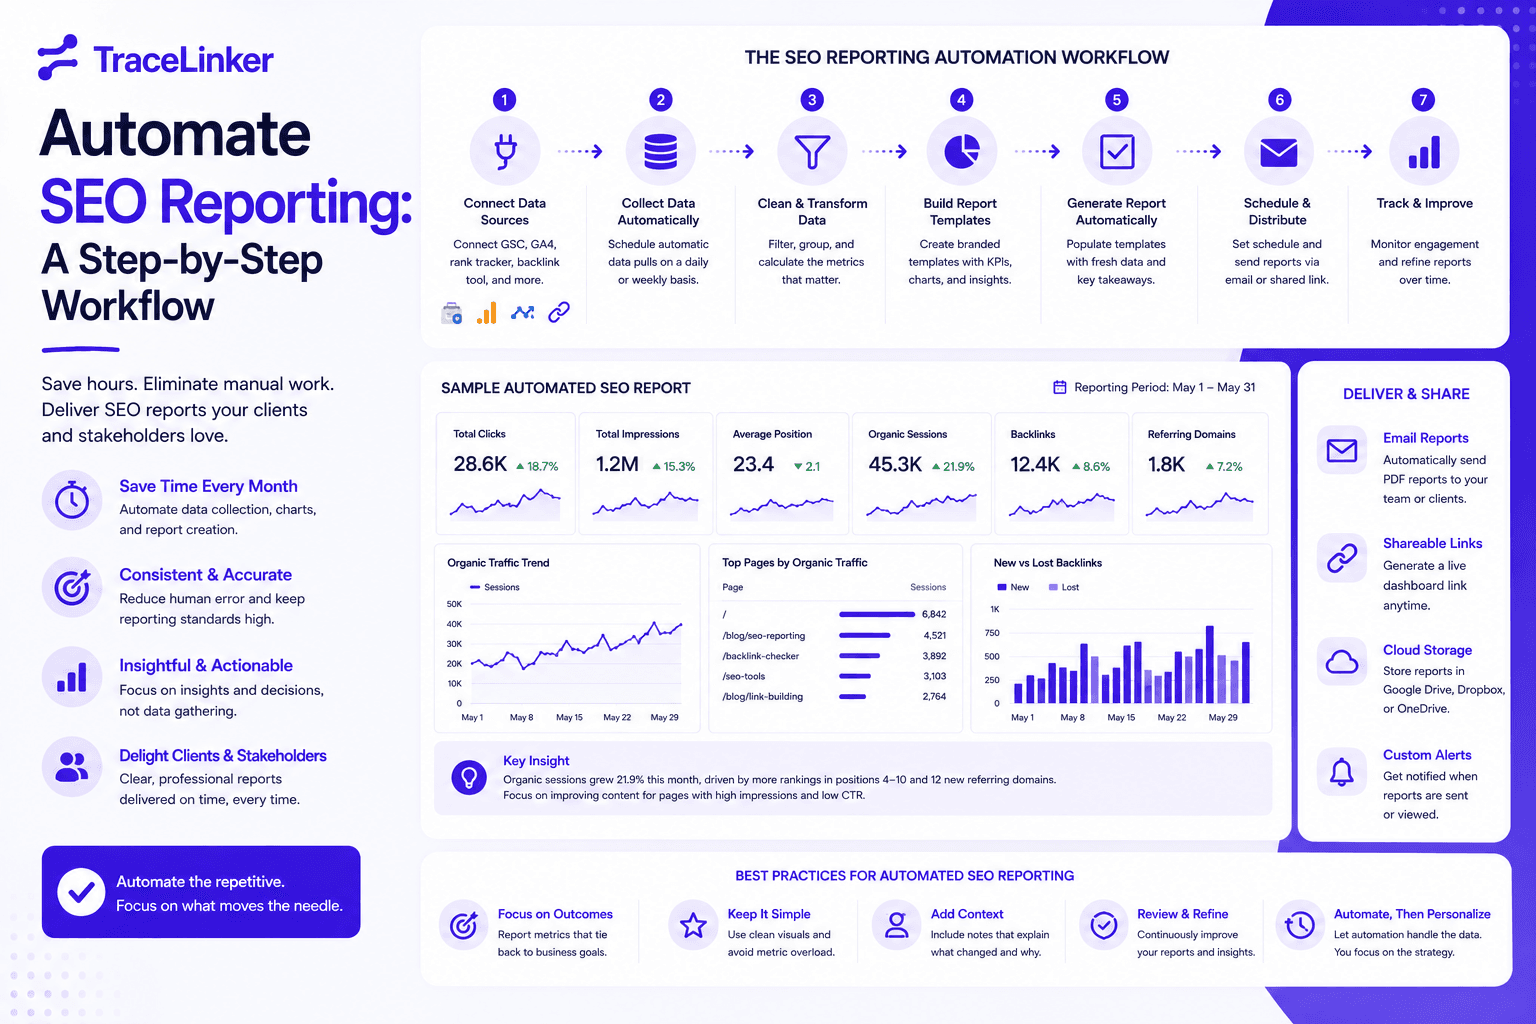


Automate SEO Reporting: A Step-by-Step Workflow
SEO reporting is one of the most time-consuming parts of running an SEO program. Every month, someone has to pull data from Google Search Console, Google Analytics, rank trackers, backlink tools, and site auditors, then format it into a report that stakeholders can understand. Automating this process gives you back hours of analysis time and makes your reports more consistent.
This guide walks through a practical workflow for automating SEO reporting. It is written for in-house SEO teams, agencies, and freelancers who want reliable reports without spending every Friday copying numbers into slides.
What automated SEO reporting actually means
Automated SEO reporting has two parts:
- Automated data updates. The report pulls live data from your SEO tools on a schedule so you are not copy-pasting numbers every week.
- Automated delivery. The report is emailed, shared, or exported automatically at a set interval, such as weekly or monthly.
A well-built automated report answers the questions your team or client actually cares about: what changed, why it changed, and what to do next. It is not a 40-page slide deck of every metric you can find. It is a focused snapshot of performance with context built in.
Why automate SEO reporting
The benefits go beyond saving time:
- Consistency: every report uses the same metrics, formatting, and cadence.
- Faster decisions: when data updates daily or weekly, you spot trends sooner.
- Fewer errors: automation reduces manual copy-paste mistakes and broken formulas.
- Better client relationships: clients receive predictable updates and can focus on the story, not the spreadsheet.
- Scalability: you can add new clients or sites without rebuilding the process from scratch.
The main risk is that you automate the wrong report. A dashboard that shows 30 vanity metrics on auto-pilot is not useful. Before you build anything, decide what success looks like for the audience.
Step 1: define the audience and the story
Every report should have a clear reader. Ask yourself:
- Who will read this report? A CMO, an SEO manager, or a client?
- What decisions do they make with it?
- What is the one thing they need to know this week or month?
- Which metrics prove progress toward the business goal?
A report for a CMO should focus on revenue, traffic, and ROI. A report for an SEO specialist should include technical issues, keyword movements, and backlink changes. A report for a client should show what you did, what happened, and what comes next.
Step 2: choose your data sources
Most SEO reports use three types of data:
Google Search Console
GSC gives you the most reliable organic search data: clicks, impressions, average position, CTR, indexed pages, and Core Web Vitals. It is free, directly from Google, and should be in every SEO report.
Google Analytics 4
GA4 adds context about traffic behavior: sessions, engaged sessions, conversions, bounce rate, top landing pages, and channel mix. It is essential for connecting SEO to business outcomes.
Your SEO tools
Backlink tools, rank trackers, and site auditors add competitive and technical context. The challenge is that third-party data is rarely as accurate as Google data. Use it for trends and competitive comparisons, not as a source of truth.
If you are using TraceLinker, your backlink data can be exported as CSV or PDF and included in client reports. You can also import CSVs from Ahrefs or Semrush into the backlink CSV analyzer to standardize link quality scoring before it goes into the report.
Step 3: choose the right KPIs
A good automated report has five to eight KPIs. More than that becomes noise. Here are the categories you should cover:
Organic traffic and visibility
- Organic clicks and impressions from GSC
- Organic sessions from GA4
- Brand vs. non-branded traffic split
- Top landing pages and top growing pages
Keyword performance
- Rankings for core keywords
- Keyword distribution by position range
- New and lost keywords
- Featured snippet and AI Overview visibility
Technical health
- Crawl errors and index coverage
- Core Web Vitals status
- Mobile usability issues
- Broken internal links
Backlink profile
- New and lost referring domains
- Total backlinks
- Toxic or spam score trends
- Anchor text distribution
Conversions and business impact
- Goal completions or key events from GA4
- Conversion rate by channel
- Revenue from organic traffic, if applicable
The exact mix depends on the client. An ecommerce site needs conversion and revenue data. A content site cares more about traffic, engagement, and keyword growth. A local business needs local pack visibility and GMB metrics.
Step 4: pick your reporting tool
There are several ways to build an automated SEO report, depending on your budget and technical skills.
Looker Studio
Google Looker Studio is free and connects directly to GSC, GA4, Google Sheets, and many third-party connectors. It is best for interactive dashboards and scheduled PDFs. The downside is that it can be slow with large datasets and lacks advanced customization.
Google Sheets + Apps Script
Google Sheets is a lightweight option. You can pull data from GSC and GA4 using the API, build charts with formulas, and email the report automatically. It is flexible but requires more manual setup and maintenance.
Dedicated SEO reporting platforms
Tools like SEOcrawl, AgencyAnalytics, Databox, and DashThis are built for agency reporting. They offer templates, integrations, and scheduled delivery. They are faster to set up but more expensive and less flexible.
TraceLinker for backlink reports
TraceLinker is not a full SEO reporting platform, but it is a strong option for the backlink portion of your report. It scores links, detects toxicity, monitors lost links, and exports CSV and PDF reports. You can also white-label PDFs on the Agency tier and use the API to pull data into your own dashboard.
For backlink-specific reporting, start with the free backlink checker or upload a CSV to the backlink CSV analyzer to generate standardized link health data.
Step 5: build the report
Once you have your tools and KPIs, build the report in this order:
- Connect the data sources. Authorize GSC, GA4, and any third-party tools.
- Create a summary section. Put the most important numbers and trend arrows at the top.
- Add detail sections. Break down traffic, keywords, technical issues, and backlinks.
- Include annotations. Add notes for major changes, such as a site migration, algorithm update, or campaign launch. Annotations turn a dashboard into a narrative.
- Add a next-steps section. List the actions that will be taken before the next report.
- Apply branding. Use the client’s colors, logo, and domain for a professional look.
- Set the schedule. Choose weekly or monthly delivery, and pick the recipients.
A strong report has a clear hierarchy: summary first, then supporting details, then recommendations. Do not make the reader hunt for the bottom line.
Step 6: automate delivery
Most reporting tools let you schedule email delivery. When you set this up, keep these tips in mind:
- Send reports before weekly or monthly client calls. Give people time to review.
- Use a consistent subject line. This makes it easy to search past reports.
- Attach a PDF and include a link to the live dashboard. Some clients prefer PDFs, others want to click into the data.
- Keep the email short. Summarize the top 3 takeaways in the body.
- Limit recipients. Send reports to decision-makers, not to everyone in the company.
Step 7: review and refine
Automation is not a set-and-forget task. Every quarter, review the report and ask:
- Are these metrics still relevant to the business goal?
- Is anyone actually reading the report?
- Are there questions that keep coming up that the report should answer?
- Are there metrics that never change and should be removed?
- Is the data accurate and up to date?
If a section is never discussed, remove it. If a client keeps asking about a specific metric, add it. The goal is a report that drives action, not one that checks a box.
Best practices for automated SEO reports
- Start small. A one-page summary report is better than a 30-page dashboard that no one reads.
- Use comparisons. Show month-over-month, year-over-year, and progress toward targets.
- Focus on changes. A report that only lists current numbers is boring. Highlight what moved and why.
- Add context, not just data. Explain what the numbers mean and what to do about them.
- Keep the design clean. Avoid clutter, use consistent colors, and make sure charts are readable on mobile.
- Protect sensitive data. Use protected links or password-protected PDFs for client reports.
- Have a backup plan. If a data source breaks, know how to generate the report manually.
Common mistakes to avoid
- Reporting too often. Daily SEO reports create noise. Weekly or monthly is usually enough.
- Including vanity metrics. Pageviews and follower counts rarely tell a useful story.
- Ignoring data quality. Third-party ranking data can be inaccurate. Always verify against GSC.
- Forgetting annotations. Without context, a traffic spike looks like a mystery.
- Automating a bad report. If the manual report is confusing, automation will just send confusion faster.
- Over-automating the narrative. Data can be automated, but insights and recommendations still need human judgment.
How TraceLinker fits into automated SEO reporting
TraceLinker focuses on the backlink and link-health side of reporting. If you are building an automated SEO report, you can use TraceLinker to:
- Monitor new and lost backlinks with state-change alerts.
- Score link quality with AI reasoning and export the results.
- Detect toxic links and generate a Google-ready disavow file.
- Import CSV data from Ahrefs, Semrush, and Moz for consistent scoring.
- Export CSV and white-label PDF reports for client delivery.
- Pull data via API into your own reporting dashboard.
If you want to include backlink metrics in your automated report, start with the anchor text analyzer to check anchor distribution, then use the backlink CSV analyzer to prepare link-quality data for import into your dashboard.
A simple starter report template
If you are building your first automated SEO report, start with this structure:
| Section | Metrics |
|---|---|
| Executive summary | Organic traffic, conversions, ranking changes, top wins |
| Traffic | Organic sessions, clicks, impressions, CTR, top pages |
| Keywords | Core keyword rankings, new/lost keywords, position distribution |
| Technical | Index coverage, Core Web Vitals, crawl errors, broken links |
| Backlinks | New/lost domains, total backlinks, spam score, anchor text |
| Next steps | 3 to 5 actions before the next report |
This template is easy to customize and covers the areas most stakeholders care about.
Final thoughts
Automated SEO reporting is not about replacing analysis. It is about removing repetitive data collection so you can spend more time on strategy and communication. A well-designed report tells a clear story, flags what needs attention, and gives the reader a reason to care.
Start by defining the audience, choosing a few high-impact KPIs, and connecting the right data sources. Then build a simple report, schedule it, and refine it over time based on feedback. As your reporting matures, you can add more data sources, deeper segmentation, and client-specific branding.
If you are building reports for clients, use our guide on client SEO reports to structure the narrative, and combine it with the backlink CSV analyzer to keep your link-quality data clean and actionable.